Savings
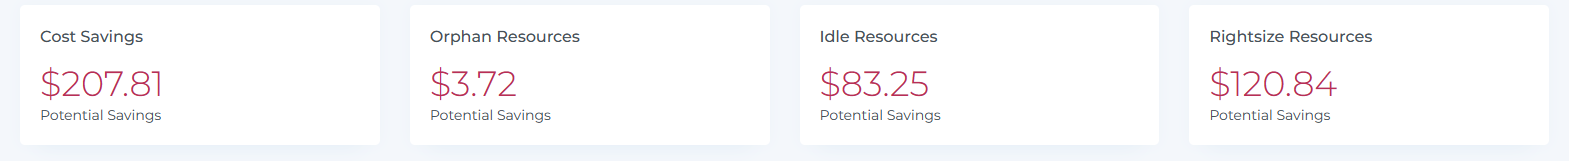
Cost Savings
The cost-saving widget shows the total potential savings for various resources. By clicking on a specific cost, users can access recommendations for how to achieve those savings and view relevant data. These recommendations are displayed in accordance with the cost that was clicked. The widget helps users identify opportunities to reduce costs and increase efficiency by identifying areas where changes or improvements can be made.
Orphan Resource
The orphan resource widget shows the number of recommendations for various orphaned resources. By clicking on a specific orphan recommendation, users can view data and further recommendations for managing that resource. These recommendations are displayed in accordance with the orphan recommendation that was clicked. The widget helps organizations identify and address orphaned resources, allowing them to optimize their use of resources and avoid waste.
Idle Resource
The idle resource widget shows the number of recommendations for resources that are not currently in use. By clicking on a specific idle recommendation, users can view data and further recommendations for managing that resource. These recommendations are displayed in accordance with the idle recommendation that was clicked. This widget can be helpful for organizations looking to optimize their use of resources and improve efficiency by identifying and addressing resources that are not being utilized.
Rightsize Resource
The rightsize resource widget provides recommendations for underutilized resources. By clicking on a specific recommendation, users can view data and further recommendations for managing that resource. These recommendations are displayed in accordance with the recommendation that was clicked. This widget can be useful for organizations looking to optimize their use of resources and reduce costs by identifying and addressing resources that are not being utilized to their full potential.
Recommendations
The recommendation widget shows all recommendations across all providers, including AWS, GCP, and Azure. This feature allows users to view a comprehensive list of recommendations for optimizing their use of resources and reducing costs across all providers.
You can select multiple rows by checking their respective checkboxes, and you also have the choice to mute all recommendations/commitments simultaneously using the select actions.
When you select the number of rows, you will be able to view that same quantity of rows on the page.
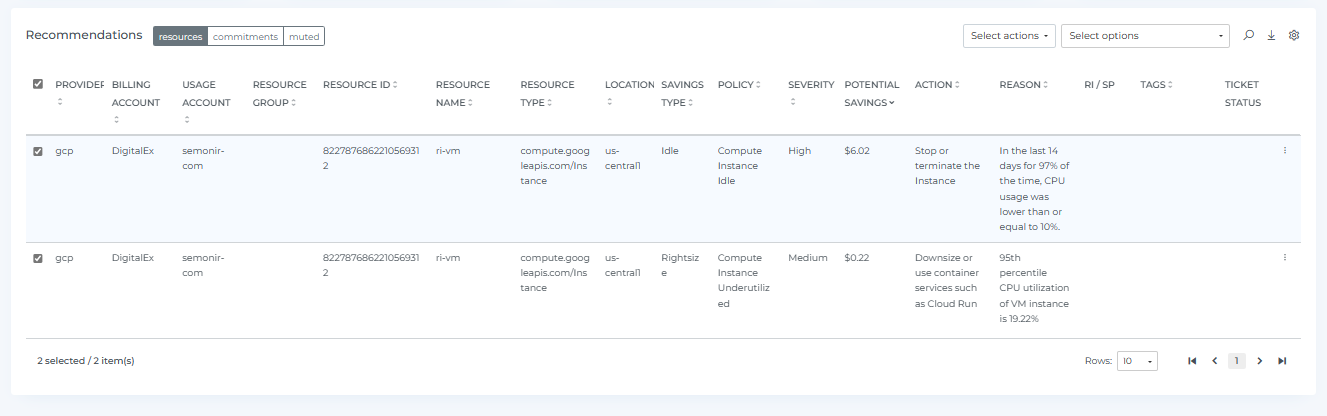
The recommendation table allows you to sort, search, and download the recommendations. You can also use the settings icon to change the way the recommendations are displayed in the user interface. The recommendations will be displayed according to the selected view. This feature provides users with flexibility and control over how they access and view the recommendations, making it easier for them to find and use the information they need.

On clicking the Commitments tab, you will be able to see Savings plan & Reserved Instance Commitments.

To access the Resource and Cost details, for that particular resource just click on the three dots located in the right corner of the resource, and then select "View Details." You can also hover the mouse over the bar to see the cost. This information can help you understand more about the resource and its associated costs.

Create / Update Ticket
To initiate the ticket creation process for that specific resource, simply click the three dots in the resource's upper right corner and choose "Create Ticket." If you've previously generated a ticket, you will find the "Update Ticket" option available.
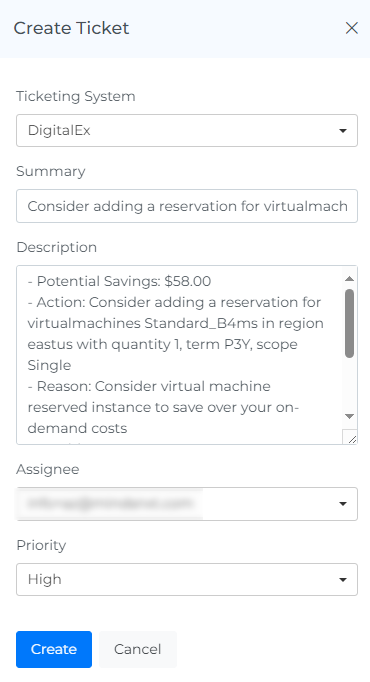
You can also generate multiple tickets at once by selecting multiple checkboxes.
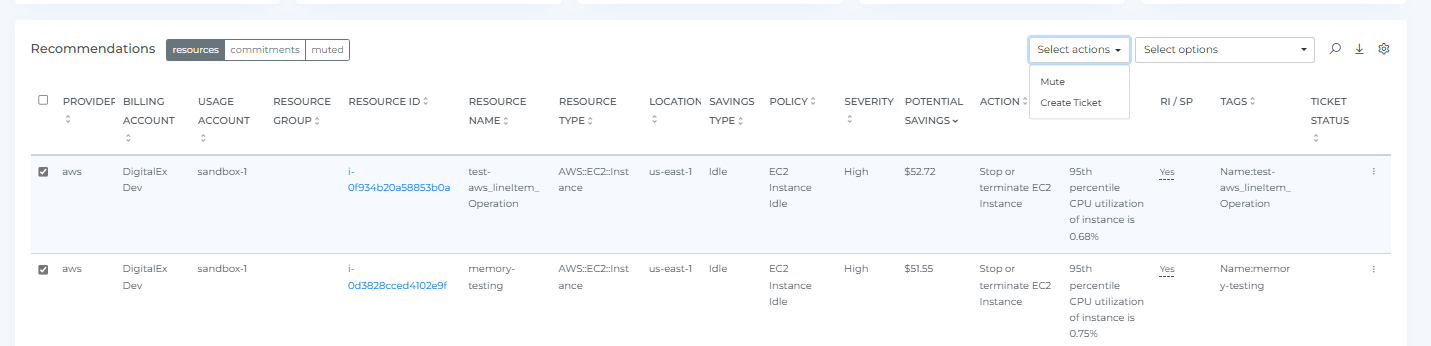
Mute/Unmute Resources & Commitments
To begin muting specific resources or commitments, click on the three dots located in the upper right corner of the resource/commitment. From the menu that appears, select the "Mute" option. If you have muted these resources/commitments before, you will see the option to "Unmute."
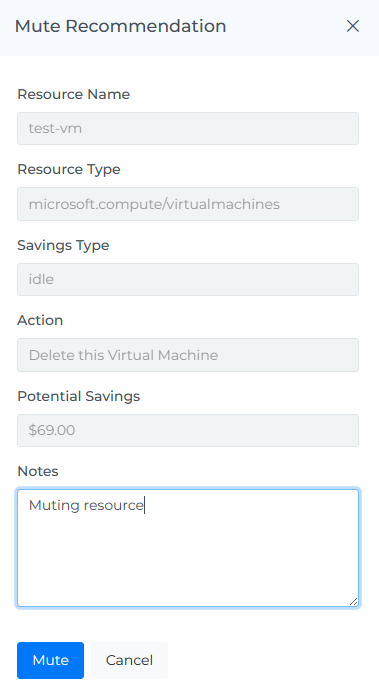
You can also mute multiple items at once by selecting their checkboxes.
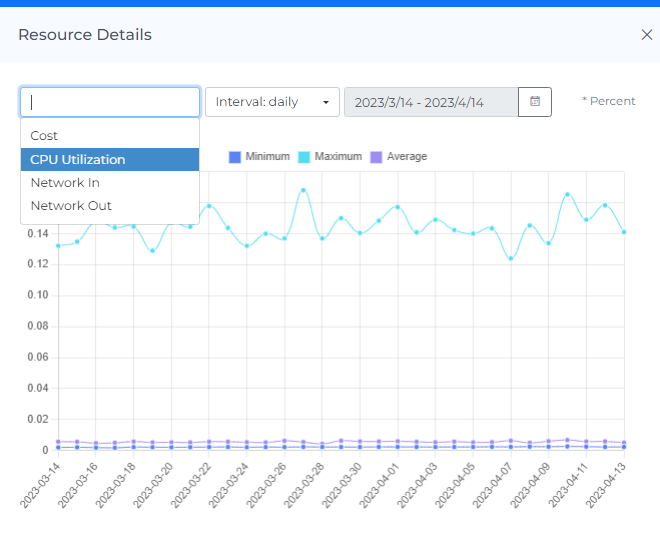
Metrics
The monitoring graphs (Metrics) for different provider services allow users to see the usage and performance of these resources over time. By clicking on the three dots in the corner of the resource instance, users can access the metrics for that particular instance and change the metric type and intervals using the drop-down menu. They can also strikethrough to manage the statistics and hover the mouse over the dots on the line graph to see usage data for daily and hourly intervals. If the daily interval is selected, users can set the date range up to the last 30 days. This type of information can be useful for understanding how resources are being used and for identifying any potential issues or opportunities for optimization.
Share
If you click on the "share" link, a link to the current page will be copied to your clipboard. You can then share this link with other team members, allowing them to access the same data and filters as you. This can be useful for collaborating with others and sharing information about your Savings recommendations.
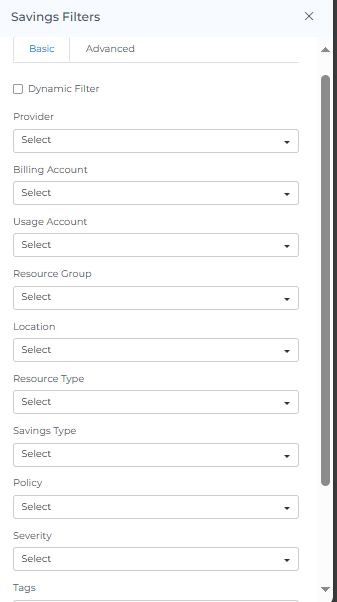
Savings Filters
Basic
The filter option allows you to narrow down the data displayed on the page to specific criteria. You can use the filter to view Savings Page for a particular Billing Account, usage Account, Location, resource type & severity. This can help you focus on specific aspects of your Savings recommendations and more effectively analyze and understand the data.
On selecting Dynamic Filter adjusts options based on previous selections. For example, choosing a Provider will update subsequent filters (e.g., Billing Account, Usage Account) to show only relevant data for that provider. This ensures efficient and context-sensitive filtering.
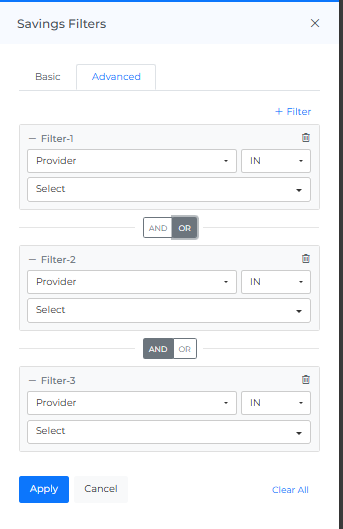
Advance
The "Advanced Savings Filters" feature use to apply detailed filters to refine search results. You can add multiple filters by selecting criteria like "Provider," choosing an operator (e.g., "IN"), and selecting values from dropdown menus. The interface includes options to apply or cancel changes and a "Clear All" button to reset filters.
Screenshot
If you click on the camera icon, you can take a screenshot of the current page and download it as a PDF file. This can be useful for saving a copy of the data or for sharing it with others.
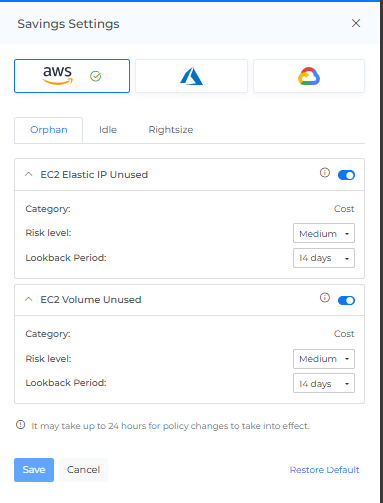
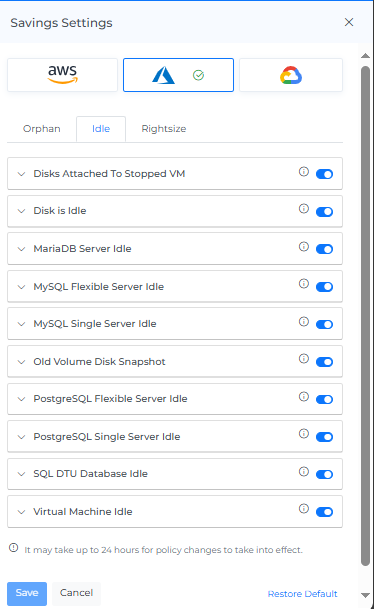
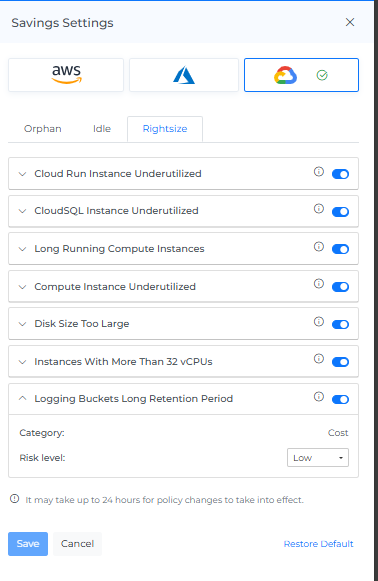
Savings Settings
You can go on/off the Settings of Recommendations.
You need to expand the particular policy to set Risk levels from dropdown & Threshold values by dragging the slider, then save the changes.
To set the default setting you need to click on the Restore default button, then save the changes.
Header Icons
Reload Option
The "reset" option allows you to clear all filters and selections from the page, returning it to the default view. This can be useful if you want to start over or view the data in its original form.
Info
The "last updated" date and time stamp show when the data on the page was last refreshed. This can be useful for understanding the age of the data and determining if it is up to date.
Help
If you click on the "?" icon, you can access the help documentation for the page. This can provide you with additional information and guidance on using the page and its features.